My Air
MyAir is a teaching kit that enables pupils in upper secondary school to explore issues of air pollution with reference to their own daily whereabouts. Armed with a mobile pollution monitor and their mobile phone, the pupils can produce digital maps that contain data about the routes they have traveled and the amount of pollution they have been exposed to at various points on these routes. The software developed as part of the MyAir project furthermore enables the pupils to upload data from their sensor and mobile phone and to merge these into a personalized map. The interface allows them to crop the map to specific time-slots and print these for discussion in class. The teaching kit can be rented by teachers by contacting the project team. It includes a mobile monitor, instructions for how to use the software, as well as a document containing teaching exercises that were tested in a 10th grade classroom in a Danish School. The aim of the teaching kit is to stimulate pupils to do inquiry into the sources of air pollution that influences their personal lives. Here, inquiry is understood with reference to a Deweyan form a pedagogics, where the role of data in scientific education is used as a tool to stimulate questions, rather than to find hard evidence giving facts about the world (Dewey, 2007 [1910/1933]).
GO TO SAMPLE DATA FROM MONITOR AND PHONE
GO TO TEACHING MATERIAL (in Danish)
Relation to the co-creation processes in SaveOurAir
In our preparation at the first SaveOurAir data sprint in London we had a conversation with Nick Pearce, Director of the Institute for Policy Research at the University of Bath, who suggested that schools were an interesting site of potential intervention with local data storytelling about air pollution. The fact that kids are affected by the issue is a good lever to also raise awareness amongst their parents and local communities, not only for citizens taking action, but also to build broader support for bigger policy changes at regional- and national level. The idea of building a tool that enables upper secondary pupils to tell personalized data stories was also discussed with other stakeholders and it ended up being a guideline for the SaveOurAir data sprint in London
During this first sprint we met with Rachel Wrangham and Pamela Edwards from Camden Air Action who told us about existing initiatives aimed at gathering data on pollution around schools. These initiatives included for example helping pupils to put up diffusion tubes in strategically selected spots around the school to measure NO2. During our conversations, we developed the idea that it would be interesting to experiment with less static ways of telling data-stories about schools. We therefore designed a first mock-up for the teaching kit and we presented it at a public event where we got useful feedback from stakeholders. For instance, we became aware of the necessity for the user to become personally involved with the data, to “fall in love with their own graph” so to say . For this to happen, we needed to have a high resolution of pollution and geo-location, and a quick response to changes in pollution levels, or else the information would not appear relevant or interesting to the user. According to the feedback and insights, this would be needed to have a commitment from the user to the teaching scenario.
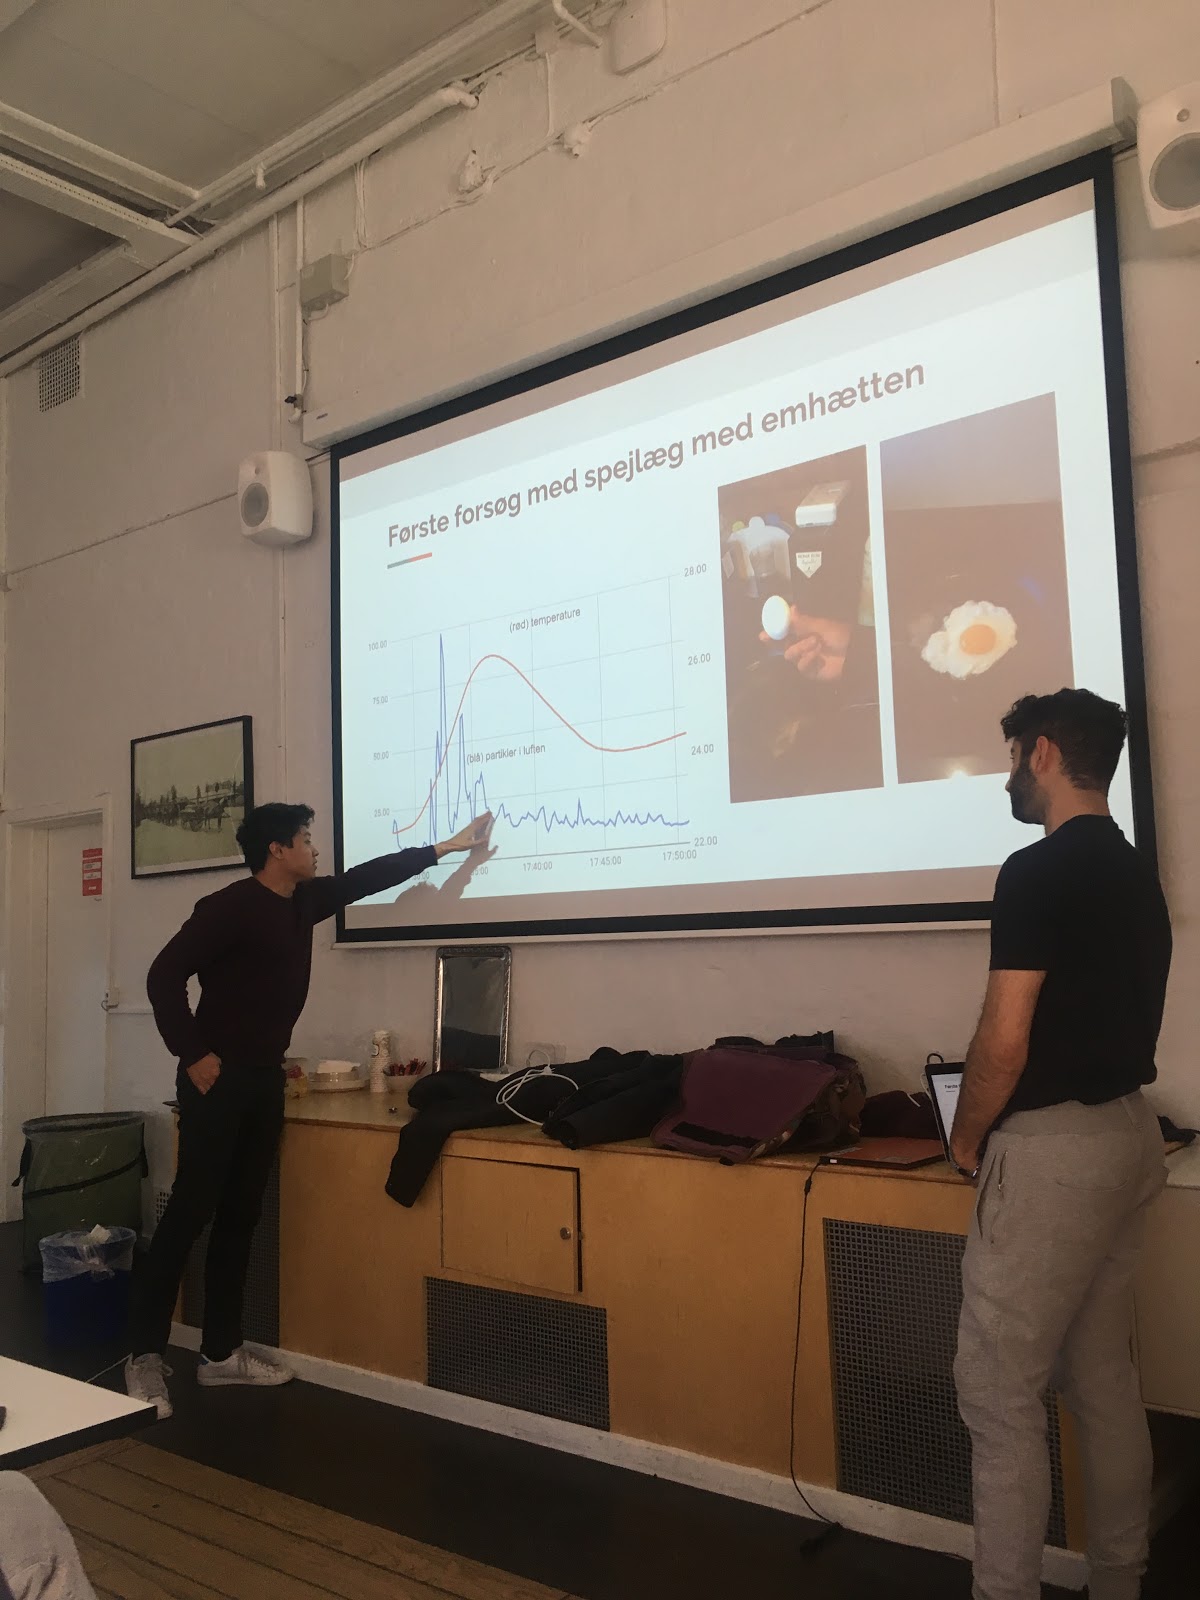
The second data-sprint in Copenhagen was dedicated to create a workable prototype based on the mock-up produced in London. However, before making the final design we needed inputs from a teacher to help with the data-visualizations shown to the pupils, as well as to specify the teaching context in which our tool could be used. After making initial design sketches, we met with Niels Gorm, a teacher from a school in Gentofte, Copenhagen. He gave us useful feedback and invited us to come and test our teaching kit for three days in his class. This ‘design after design’ event was held in March. Full documentation of the event can be found here.
Furthermore, the prototype received useful feedback during final sessions in London with the original participants of the London sprint. Here, it was discussed how the project could be scaled to schools outside Denmark. Also, it was discussed whether and how the pupils changed behavior after the teaching exercises. Finally, it was emphasized that using this teaching material may give rise to ethical issues. One scenario could be that pupils find out that people living in poor neighborhoods are more exposed or people having smoking parents are more exposed to air issues than the rest of the class. Such potential ethical situations must be debated before use in class.
The user/public context
The teaching kit is designed with the 10th grade pupils in mind and it was ultimately tested on this user group. Also, it is build with a specific conception of these users in mind. It builds on the premise that students get engaged in the learning exercise when they are invited to actively measure and compare. Again, designing for this active and problem-based mode of learning is something that can be traced back to the Deweyan foundation of the project (Dewey, 2007 [1910/1933]). This emphasis on active learning that is related to everyday life is something that is integrated in the curricula of Danish Schools. Through our conversation with Niels we got a better sense of the kind of user we were designing for. For instance, we learned that his pupils were allowed to leave the school with a monitor in order to do experiments. Before we met with Niels, we were actually unsure about whether such off-school activities would require teachers to come along. These conversations enabled us to design both the interface and the teaching activities with more detailed knowledge of the potential user.
Ultimately, this persona - the active pupil who can move around and do inquiry into his/her own daily whereabouts - anchors the project in a problem-based philosophy of teaching. This teaching draws lines back to educational theorists such as John Dewey, who promoted the idea that pupils learn most effectively when they are allowed to engage experimentally with the aspects of the world they want to learn about (Dewey, 2007 [1910/1933]). Broadening the scope from the 10th grade in Gentofte, the MyAir teaching kit has the potential to equip various publics (e.g. air activists) with new and more interactive means of representing the issue of air pollution, compared to the more static measures we encountered during the first sprint in London. Event though the tool is designed and tested in the context of a 10th grade in Denmark, it has a broader reach.
The data used in the project
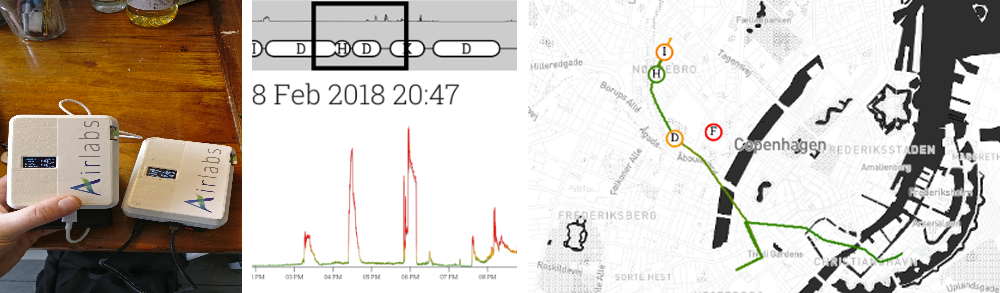
MyAir is a teaching kit that works by assembling the following four types of data-sources:
- First, the kit includes a monitor developed by Airlabs that measures pollution at PM2.5 and PM10 levels. The monitor is portable and when the pupils carry it around, it produces data-points at a specified time granularity. For instance, one can set it to measure particles every five seconds and it will export a .txt file with these measurements on to a SD-card.
- Second, the kit currently includes public data on yearly estimated averages of PM2.5 and PM10 levels from all households in Denmark. This data is based on modelled data from the Danish Centre for Environment and Energy (DCE) and it provides the student the opportunity to compare his/her own measurements with the official averages in the same locations that he/she has visited.
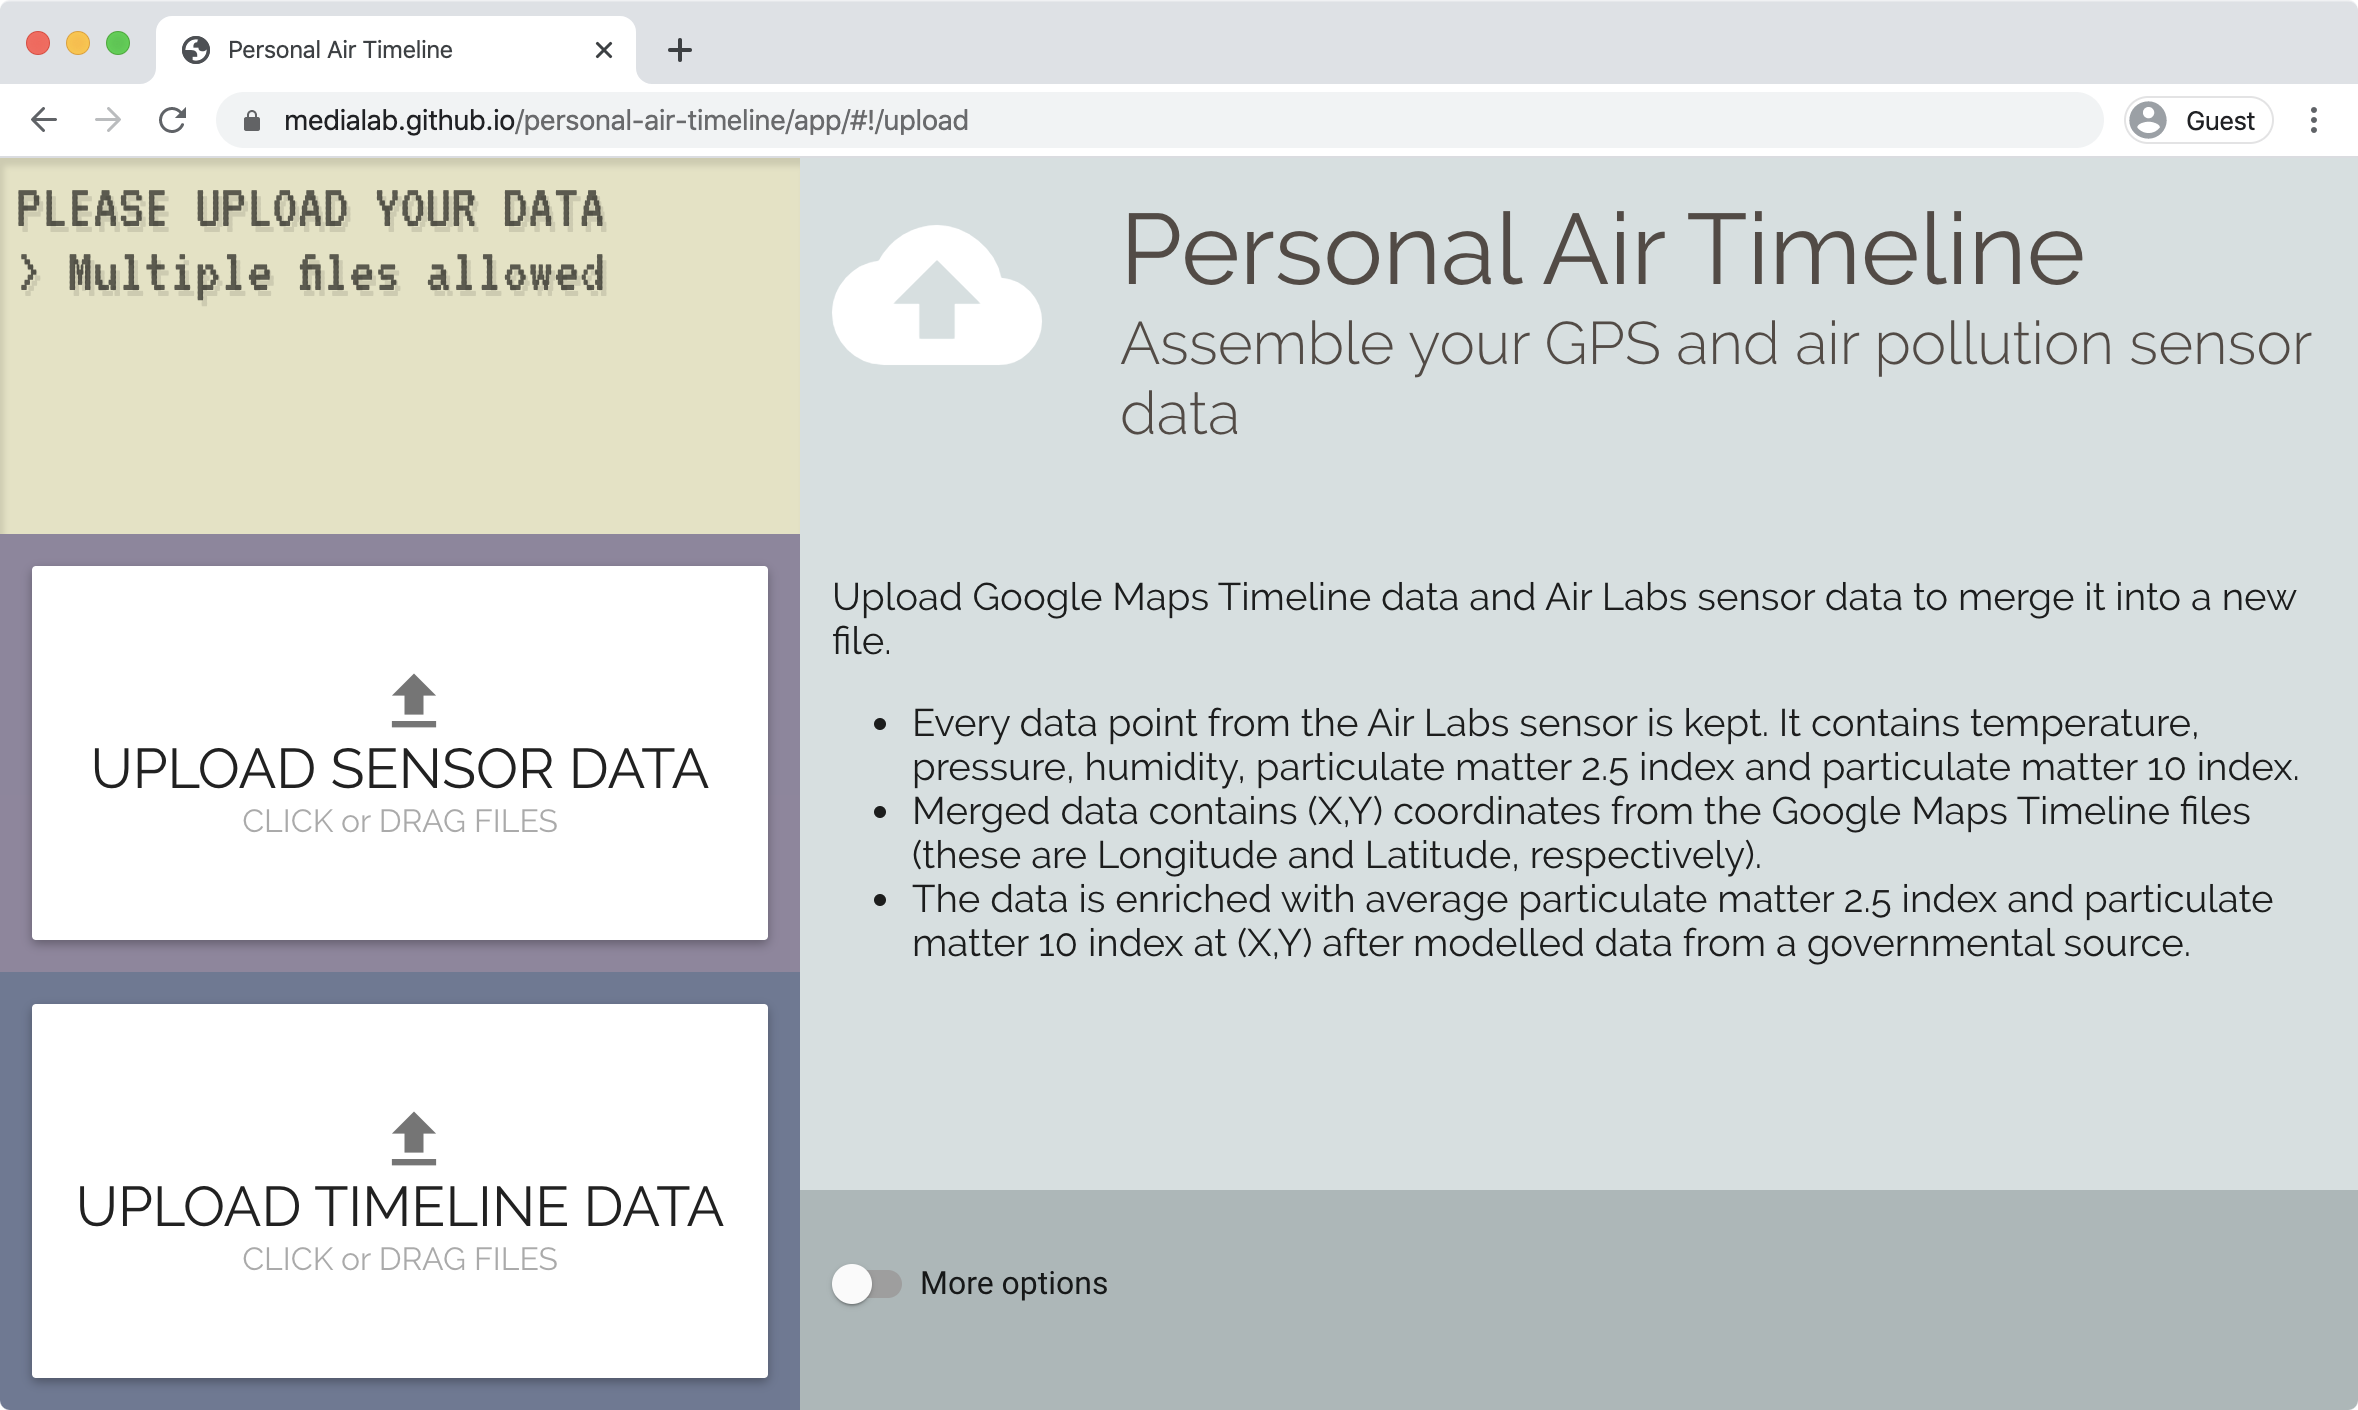
- Third, the pupils who use the kit are expected to turn on Google Timelines on their Google Maps mobile app, in order to track their whereabouts. When this is turned on, the pupils can export a .kml file from their monitor carried around, which includes data-points containing the time, latitude and longitude of their movement.
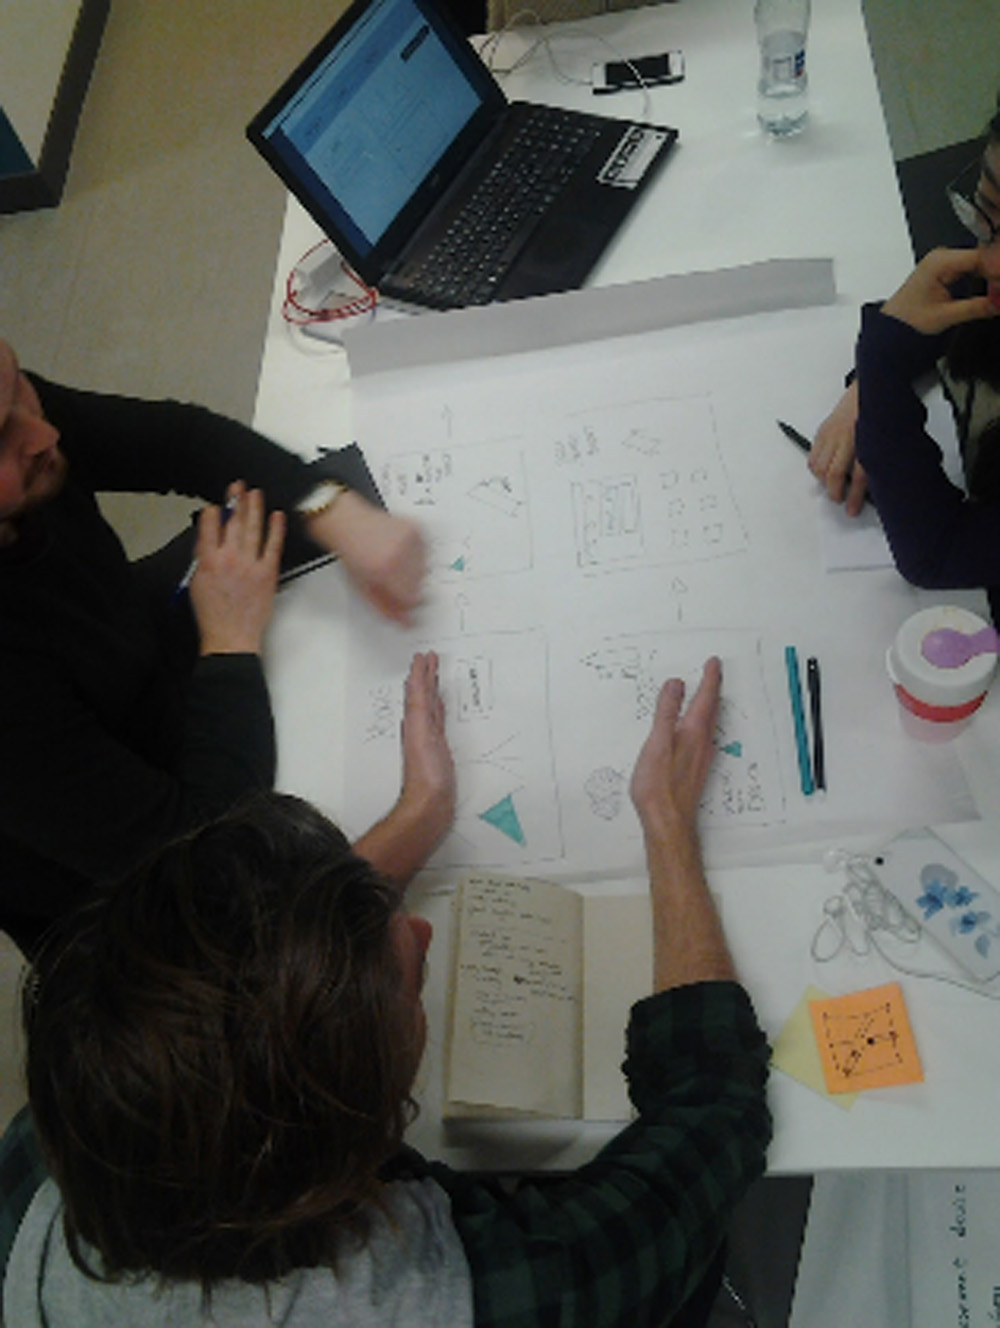
The third data-source mobilized in the teaching kit is a journal pupils fill out while having the monitor. Pupils are asked to note down the context in which they are measuring, and provide guesses on the potential pollution sources existing in that situation. For instance, the picture below shows two students making such notes during our field test at Gentofte School.
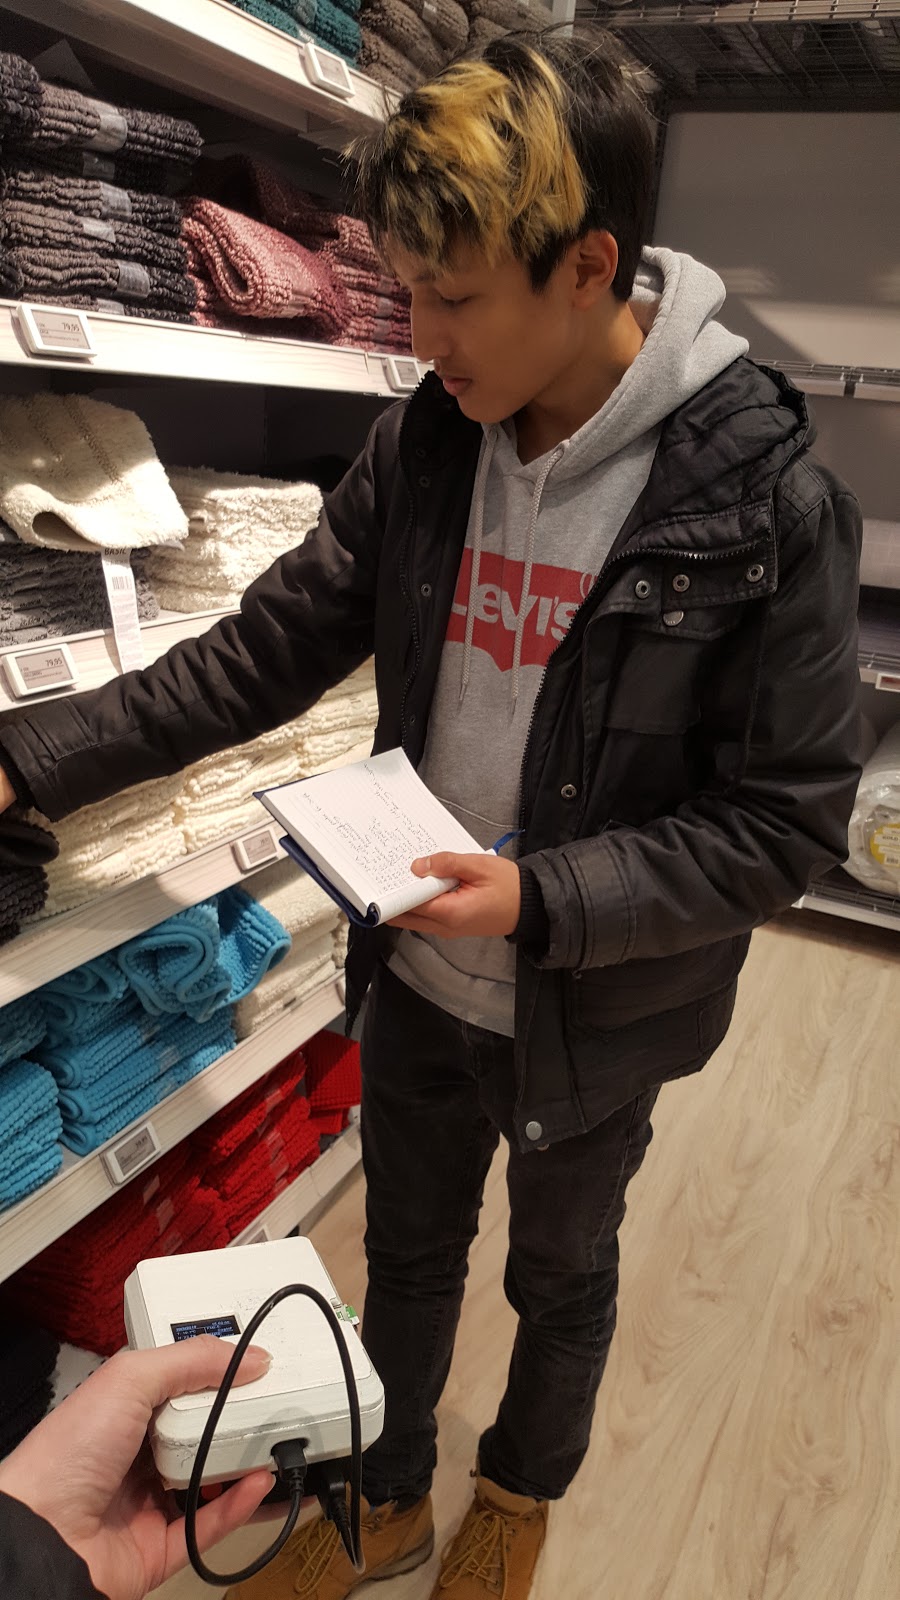
One of the roles that these notes play in the teaching situation is that they guide the selection of interesting timeframes in the map to be further explored. Here, the question about data quality is not whether these notes are “true”, in the sense that the students remember the situation 100% correctly, but rather whether the annotations succeed in making the students interested in their own habits and whereabouts. The purpose of this is to ground the more conventional data-sources, such as the PM outputs from the monitor, in a personal biography.
The ‘situating techniques’ used to make data-stories local
This brings us to the situating technique of the MyAir experiment, which can be summarized as personalization. In the visual interface, data is represented with reference to the personal localities and timeline of the user. The way the interface enables interaction and inquiry is driven by the idea that it is the everyday life of the pupil that should guide the way he/she begins to ask questions about the issue of air pollution. This also means that peaks and patterns in the visualization, that may be considered noise or outliers in other data-practices, can be the most valuable in a MyAir project. An example could be peaks in exposure when a train moves by that would otherwise be considered an uninteresting irregularity if one were only interested in yearly averages.
Accordingly, the situation technique of personalization is a different way of making data local, compared to the often used technique of geo-referencing. For instance, the official data on yearly averages and the map produced by the reconciler have the same level of granularity when it comes to geo-coordinates. For both datasets you could select your house and get a pollution level. The difference between the two lies in the strategy for situating. The official data prompts questions such as, “is this street generally more polluted than this street”, whereas the MyAir map prompts questions such as, “was I more exposed to pollution on this street when I biked than when I was in a car”. The personalized situating technique offers different types of questioning and thereby different types of learning. This is also true when compared to the initial initiatives of data and schools that we encountered in our conversations with activists in the London-sprint. Personalized timelines provide for different modes of engagement, compared to static diffusion tubes outside a school.
What have we learned from the process?
During our test of the teaching kit in the 10th grade we saw the potentials of using personalization as a technique to stimulate specific modes of inquiry concerning the issue of air pollution. The software of MyAir prioritizes data that is produced by mobile devices in a granular fashion. This means that pupils can turn their everyday whereabouts into data and think of changes in their daily practices. The effect of these adaptations, or small experiments, can then be seen in their data. Accordingly, we learned how data can play a role in the inductive and hypothesis-generating aspects of a learning situation and not just function as evidence to be memorized. We experienced in practice how making data mobile and granular underpins a distinct form of experimental and problem-based learning.
More specifically, we also learned a great deal about our user group, 10th graders in Denmark. First, we were impressed by their knowledge. We started the first day of the test by asking ourselves whether the level of the initial presentation on air pollution was too low. They seemed very trained in taking in data and facts such as the difference between PM2.5 and PM10. However, we also experienced that they struggled with the parsing of the data and making the hypothesis for their experiments. This shows that the aim of creating a software, that engages pupils in experimental modes of reasoning, is a useful addition to the learning-technologies already available. In general we think that the prototype turned out promising. The educational material in MyAir is intended to fill a whole week of schooling. Probably we should have tested MyAirfor this amount of time. However, for a proof of concept, we believe that our three days in Gentofte worked well.
Next steps and requirements for the project
The current status of the project is that we developed a functional prototype which was tested for three days in a Danish School. The teaching kit, which consists of a monitor, the software and teaching exercises can be rented by interested teachers who want to conduct air pollution inquiries with their students. Furthermore, we imagine that this kit can also be useful for other users who wants to engage in such inquiries such as activists and citizen science groups.
In order to scale the project, there is a need for an external actor to take it up and promote it further. We have had conversations with a Danish organization that hosts and organizes the distribution of teaching materials and we have discussed the possibility of using the teaching kit as the case in a so-called ‘mass-experiment’ that will take place in natural science classes across the country in 2019. Besides that we have seen interests from politicians in London to work with the prototype in relation to campaigns about air pollution in and around schools.
References
- DEWEY, John. How we Think, Digireads.com Publishing, 2007